Cart Abandonment: Is It a UX Problem or a Tracking Problem?
Baymard Institute's 2026 meta-analysis of 50 separate studies puts average cart abandonment at 70.22%. Seven in ten shoppers who add something to cart don't complete the purchase.
So when your own analytics show a 68% cart abandonment rate, it looks like a normal, if painful, UX problem. The standard response follows: reveal shipping costs earlier, add trust signals, enable guest checkout, simplify the form.
Sometimes that's exactly right. But a meaningful share of the time, the users in your "abandoned" bucket didn't abandon anything. They completed checkout normally, and your tracking stopped counting them somewhere in the middle.
These two problems look identical in a funnel report and require completely different responses. Here's how to separate them before you spend a quarter fixing the wrong one.
Why the Two Are Indistinguishable in GA4
GA4 doesn't measure abandonment. It measures the absence of an event.
Your cart abandonment rate is calculated as: users who fired add_to_cart minus users who fired purchase, divided by users who fired add_to_cart. Everyone who added to cart and didn't produce a purchase event lands in the abandoned bucket.
That includes users who genuinely left. It also includes:
Users whose
purchaseevent was blocked by an ad blocker or Safari's tracking preventionUsers whose session broke during a payment gateway redirect, so the purchase was attributed to a new session
Users who bought via COD on a setup that doesn't fire the full event sequence for COD orders
Users whose
purchaseevent fired without the parameters GA4 needs to associate it with their earlier session
All of these completed orders. Your platform recorded revenue from them. GA4 filed them under abandonment.
The Diagnostic Flowchart
Work through this in order. Each step eliminates one explanation.
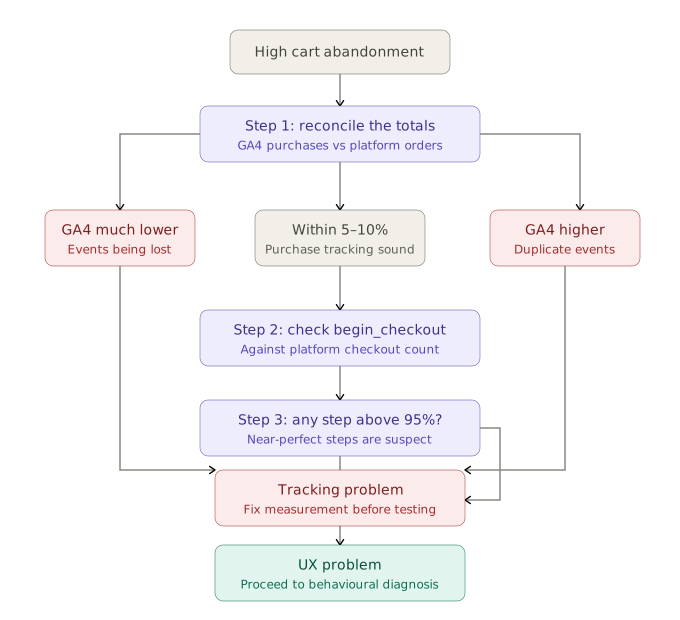
Most teams start at Step 5. The first four steps take under an hour combined and frequently change the answer entirely.
If It's a Tracking Problem
The fix depends on where the loss occurs, but three causes account for most cases.
Browser-level event loss. Between 18% and 25% of ecommerce traffic runs some form of blocking, and Safari strips third-party cookies within days. These orders complete normally and never reach GA4. Server-side tracking recovers most of it our guide to GA4 and server-side GTM setup covers the implementation.
Session breaks at the payment gateway. When users return from Razorpay, Cashfree, PayU, or a UPI app, GA4 starts a new session unless those domains are on your referral exclusion list. The purchase fires in a session with no connection to the earlier cart activity. Configure this in Admin → Data Streams → Configure Tag Settings → List Unwanted Referrals.
Incomplete COD event coverage. COD orders don't pass through a payment gateway, so add_payment_info often doesn't fire for them. On stores where COD is a substantial share of orders, this leaves a large population of buyers partially invisible in the funnel. Our guide to GA4 for brands with multiple funnels covers the payment-method segmentation this requires.
Fixing tracking doesn't reduce abandonment. It reveals what your abandonment rate actually is which is the number every subsequent decision depends on.
If It's a UX Problem
With tracking validated, the behavioural causes become worth investigating. Baymard's research attributes 48% of abandonments to unexpected costs, making it the largest single category by a wide margin.
The pattern in order of typical impact:
Costs revealed too late. Shipping charges, taxes, or handling fees appearing at the cart or checkout stage rather than on the product page. This is the highest-leverage fix on most stores.
Forced account creation. Requiring registration before checkout adds friction at the exact moment intent peaks.
Too many form fields. Baymard's checkout research finds an ideal range of 12-14 form elements, with most stores well above it. An interesting nuance from their data: a 15-field form split across three logical steps outperforms a 10-field single-page form by 11-14%. Perceived length matters more than actual length.
Missing payment methods. For Indian D2C specifically, absent UPI or COD options at checkout removes buyers who had no alternative path.
No error recovery. A failed UPI transaction that returns users to an empty cart with no retry option converts a payment hiccup into a lost order.
Unclear returns or delivery information. Particularly significant for first-time buyers who have no basis for trusting the brand yet.
Where the funnel data points, session recordings and heatmaps tell you which of these applies to your store. Our guide to signs your PDP or checkout needs a CRO audit covers the diagnostic in more detail.
Why the Order Matters
Running the UX diagnosis first isn't just inefficient, it produces confidently wrong conclusions.
Consider a store where begin_checkout stopped firing on mobile after a theme update. The funnel shows a catastrophic cart-to-checkout drop. A UX-first approach interprets this as cart page friction, rebuilds the cart page with better trust signals and clearer shipping information, and measures no improvement because the cart page was never the problem.
Worse, the real leak stays invisible for the entire duration of that work.
Our guide to distinguishing real funnel drop-offs from tracking gaps covers the broader version of this diagnostic, and our pre-CRO data audit covers the full validation scope that should precede any conversion work.
This is the sequence FunnelFreaks built the agency around. We validate the data layer before diagnosing any funnel problem because in Indian D2C, where COD flows, UPI redirects, and mobile-heavy traffic all create tracking failure modes that global setups don't anticipate, the reported abandonment rate is frequently not the real one. Every decision we make is data-backed, which requires knowing the data is right first.
The Ten-Minute Version
If you only do one thing: pull your GA4 purchase event count and your platform order count for the same 30-day window and compare them.
Gap | What your abandonment rate really is |
|---|---|
Within 5–10% | Accurate. Treat as a UX problem. |
GA4 10–20% lower | Somewhat overstated. Investigate before acting. |
GA4 20%+ lower | Substantially overstated. Fix tracking first. |
GA4 higher than platform | Understated — duplicate events. Fix immediately. |
Everything downstream — which fix to prioritise, what a test is measured against, how much revenue the leak represents — depends on that one comparison.
Not sure whether your cart abandonment rate is real? Talk to FunnelFreaks, we validate the tracking, then diagnose the funnel on numbers you can trust.